- Bitcoin’s rally is powered by ETFs, institutional buying, and macro tailwinds.
- On-chain data shows light profit-taking, but long-term holders remain steady.
- Futures and options activity signal bullish bets but raise correction risks.
- Looking for actionable trade ideas to navigate the current market volatility? Subscribe here to unlock access to InvestingPro’s AI-selected stock winners.
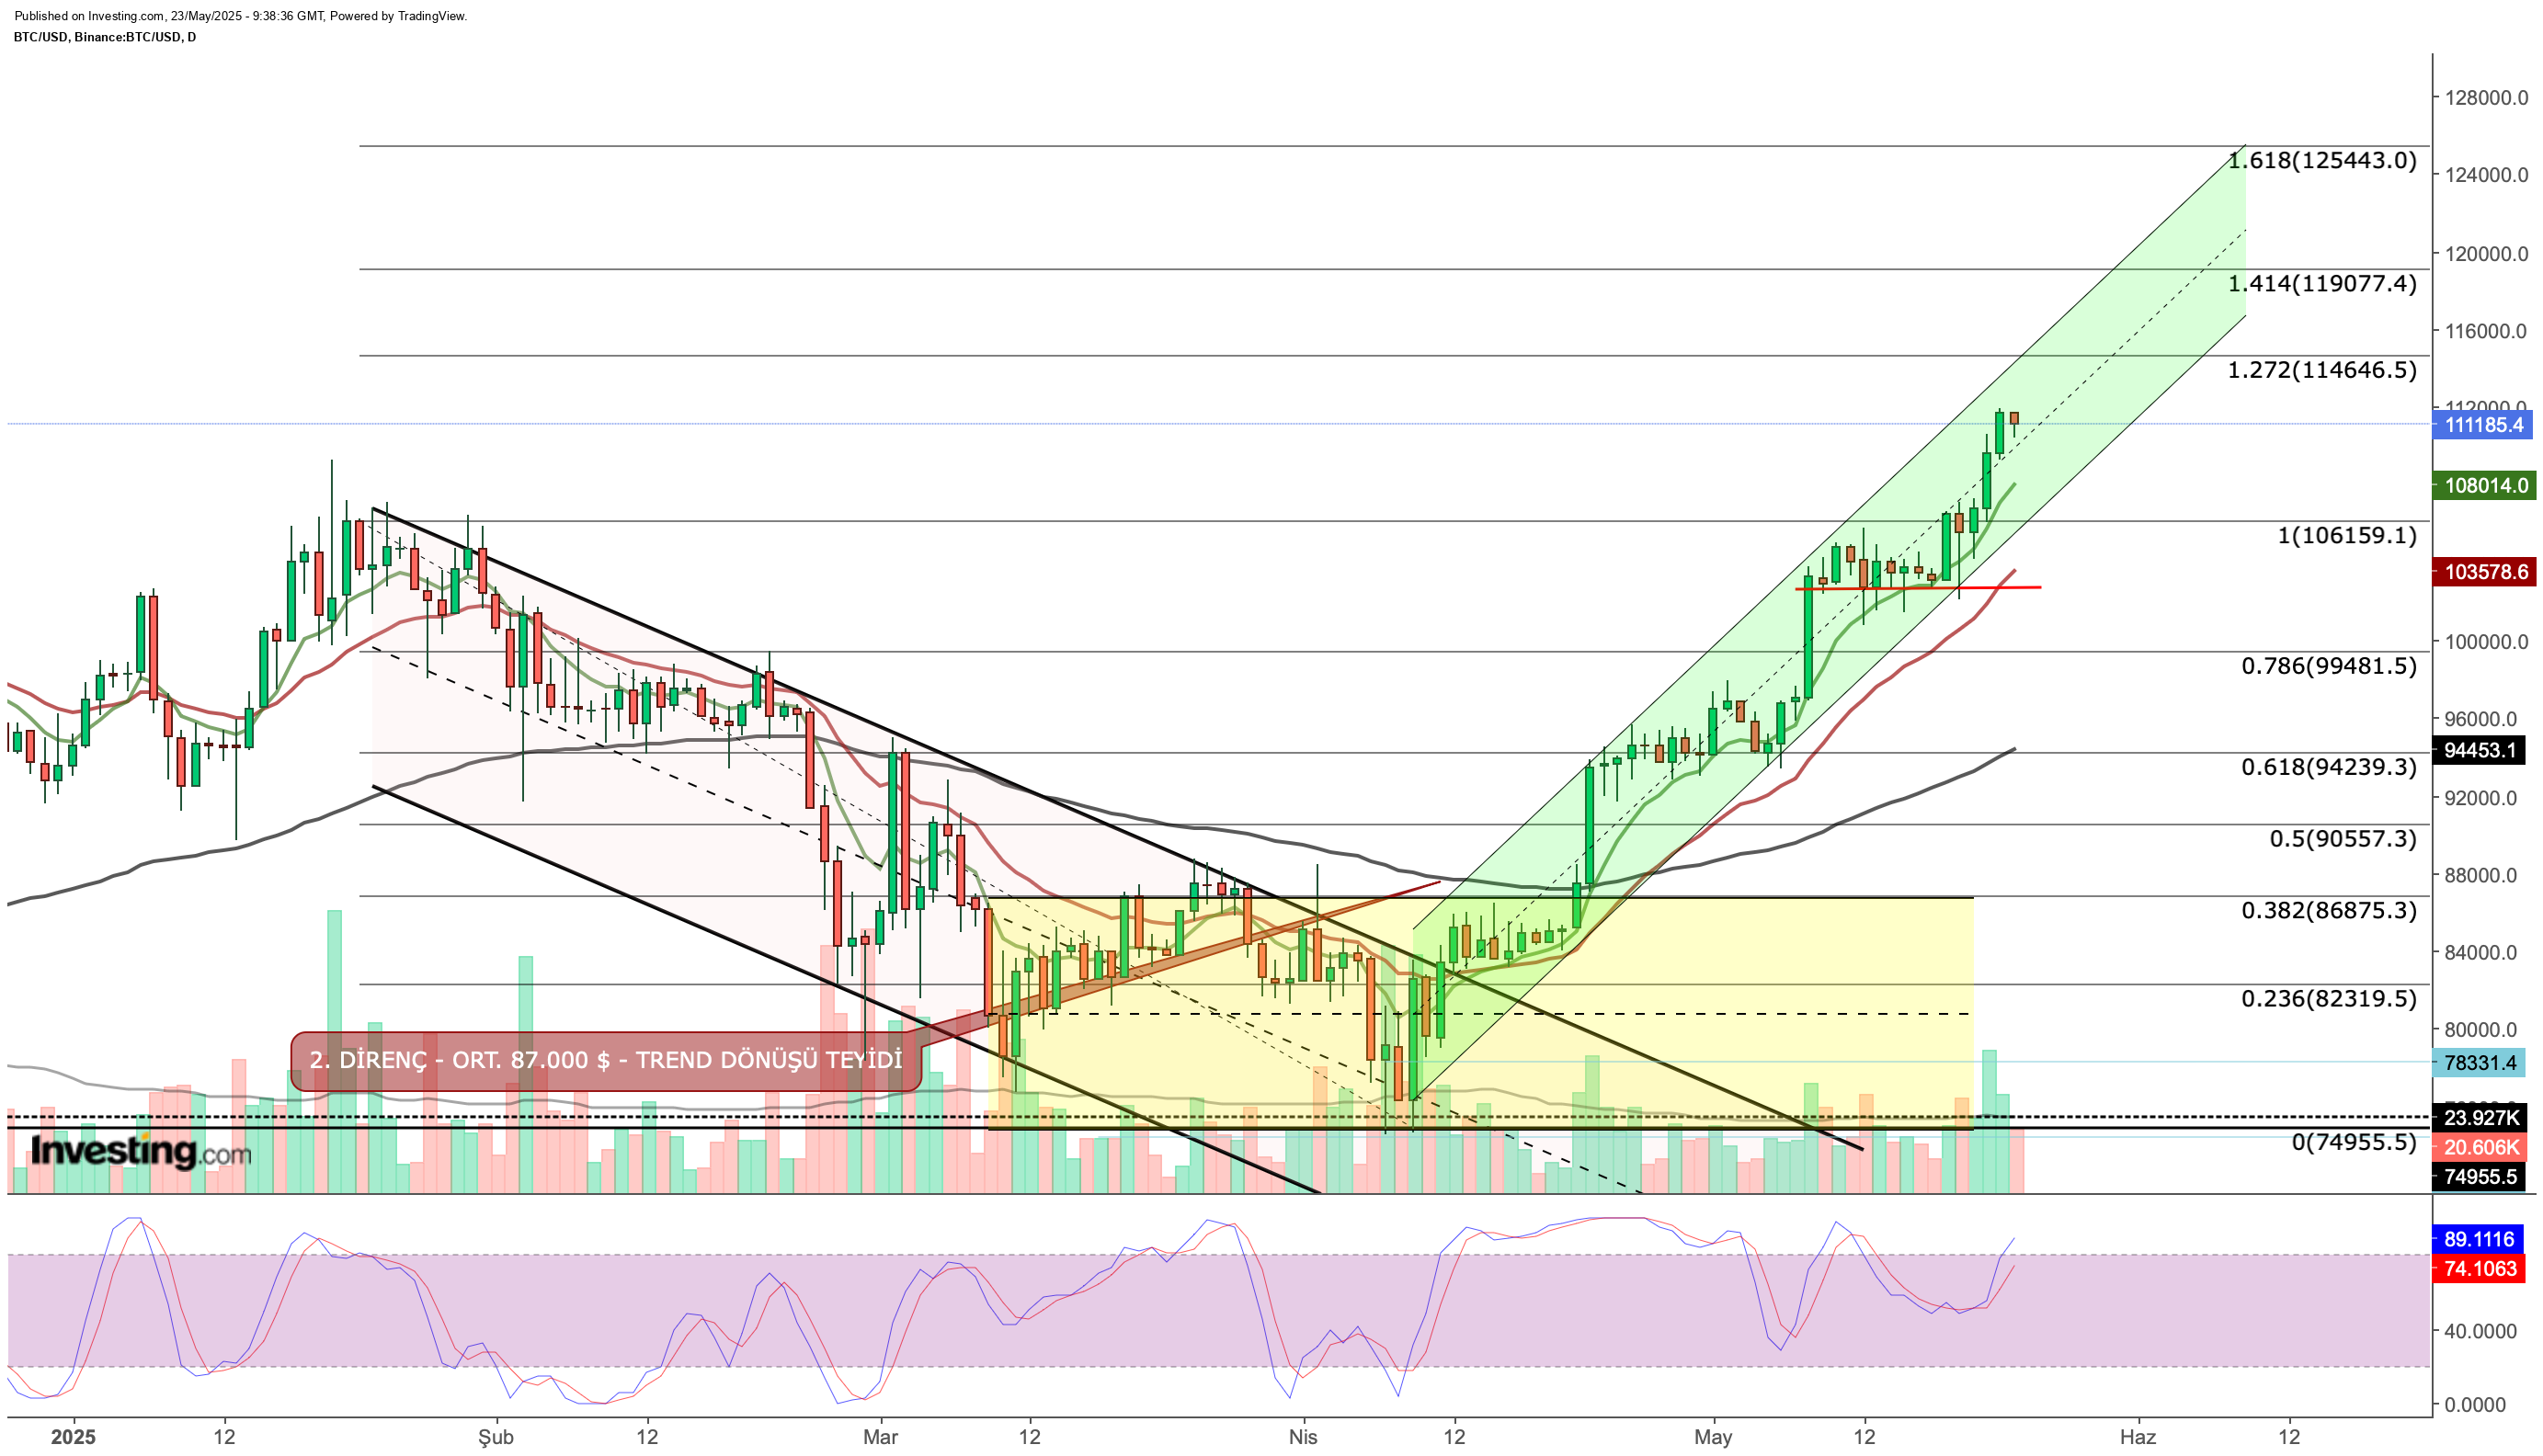
jumped sharply this week, breaking out of last week’s flat trading and reaching a new high of $111,954. It held strong around $102,000 last week, and its rise was driven by technical signals, more interest from big investors, positive regulatory news, and better overall economic conditions.
Institutional Demand Fueling the Rally
The biggest reason for Bitcoin’s recent rise is the large flow of money into US-based spot Bitcoin ETFs. BlackRock’s iShares Bitcoin Trust ETF (NASDAQ:) has become the largest institutional Bitcoin fund in the world, holding over 636,000 BTC. Major financial firms like JPMorgan, Fidelity, and Charles Schwab are now including Bitcoin in their client portfolios, showing that Bitcoin is shifting from a speculative asset to a strategic reserve tool for institutions.
In addition, ongoing Bitcoin purchases by Strategy and large buys by Japan-based Metaplanet are other key factors supporting the rise.
Trump’s Crypto Approach Supports Uptrend
US President Donald Trump’s “Strategic Bitcoin Reserve” decree this year, which recognized Bitcoin as a strategic national asset alongside gold, was well received by the market. Additionally, the first “Crypto Summit” at the White House highlighted strong political support for crypto assets.
The bipartisan compromise on stablecoin regulations shows the US is working to establish clearer laws for the crypto sector. This boosts investor confidence and lowers perceived systemic risk.
Macro Developments Raise Risk Appetite
Positive global signals triggered Bitcoin’s rally. Investors shifted toward riskier assets after Trump delayed tariffs for 90 days, and the US-UK trade deal was finalized. These events helped Bitcoin break the $100,000 psychological barrier this month.
As Bitcoin rose, the total cryptocurrency market cap hit $3.5 trillion. However, it still falls short of the $3.7 trillion record from December 2024, showing that altcoins have underperformed compared to Bitcoin.
On-Chain Data Shows Profit Selling Levels
CryptoQuant data shows 4,435 BTC moved to Binance after yesterday’s record high, suggesting short-term traders might be preparing to sell profits. However, the 30-day net flow to crypto exchanges remains negative, indicating long-term investors are holding steady.
Other on-chain indicators point to some selling pressure but are not as strong as last year’s profit-taking, supporting the view that the upward trend could continue.
Record Open Positions in Futures and Options
CoinGlass data shows open positions in the Bitcoin futures market have topped $80 billion, hitting record levels. This suggests many investors expect prices to keep rising. However, high leverage could trigger sudden liquidations if a correction happens, potentially making price drops worse.
In the options market, Deribit reports over $5 billion in open positions between $110,000 and $130,000. The put/call ratio for about $2.76 billion of contracts expiring today is above 1, signaling that short-term selling pressure is increasing.
Bitcoin’s Technical Outlook

Bitcoin paused briefly between $102,000 and $106,000 last week during its steady climb. At the start of the new week, it tested the $106,000 resistance, bounced off the $102,000 support level, and surged higher with strong buying from that zone.
The upward trend carried on through the week but slowed near $111,000 toward the end. Still, technical signals suggest more gains ahead. The next target range on the daily chart lies between $114,600 and $125,400, with $114,000 expected to be a key resistance level soon.
Support Levels and Possible Pullbacks
After easing during last week’s brief consolidation, the Stochastic RSI has turned upward again, reinforcing the uptrend with technical support. The short- and medium-term exponential moving averages (EMAs) have remained positive since the trend reversal in April.
There is no strong resistance up to the $114,000 level, though profit-taking may trigger a pullback, increasing the chance of a trend backtest. In this case, the 8-day EMA near $108,000 could provide support for short-term dips. If the decline extends to $106,000, a short-term correction lasting until the intermediate support zone at $102,000 might come into play.
****
Be sure to check out InvestingPro to stay in sync with the market trend and what it means for your trading.
Whether you’re a novice investor or a seasoned trader, leveraging InvestingPro can unlock a world of investment opportunities while minimizing risks amid the challenging market backdrop.
Subscribe now and instantly unlock access to several market-beating features, including:
- ProPicks AI: AI-selected stock winners with a proven track record.
- InvestingPro Fair Value: Instantly find out if a stock is underpriced or overvalued.
- Advanced Stock Screener: Search for the best stocks based on hundreds of selected filters and criteria.
- Top Ideas: See what stocks billionaire investors such as Warren Buffett, Michael Burry, and George Soros are buying.

Disclaimer: This article is written for informational purposes only. It is not intended to encourage the purchase of assets in any way, nor does it constitute a solicitation, offer, recommendation, or suggestion to invest. I would like to remind you that all assets are evaluated from multiple perspectives and are highly risky, so any investment decision and the associated risk belong to the investor. We also do not provide any investment advisory services.


